Estimating eddy-driven particulate organic carbon flux from remote sensing at a dynamic upwelling front
Manuscript in prep
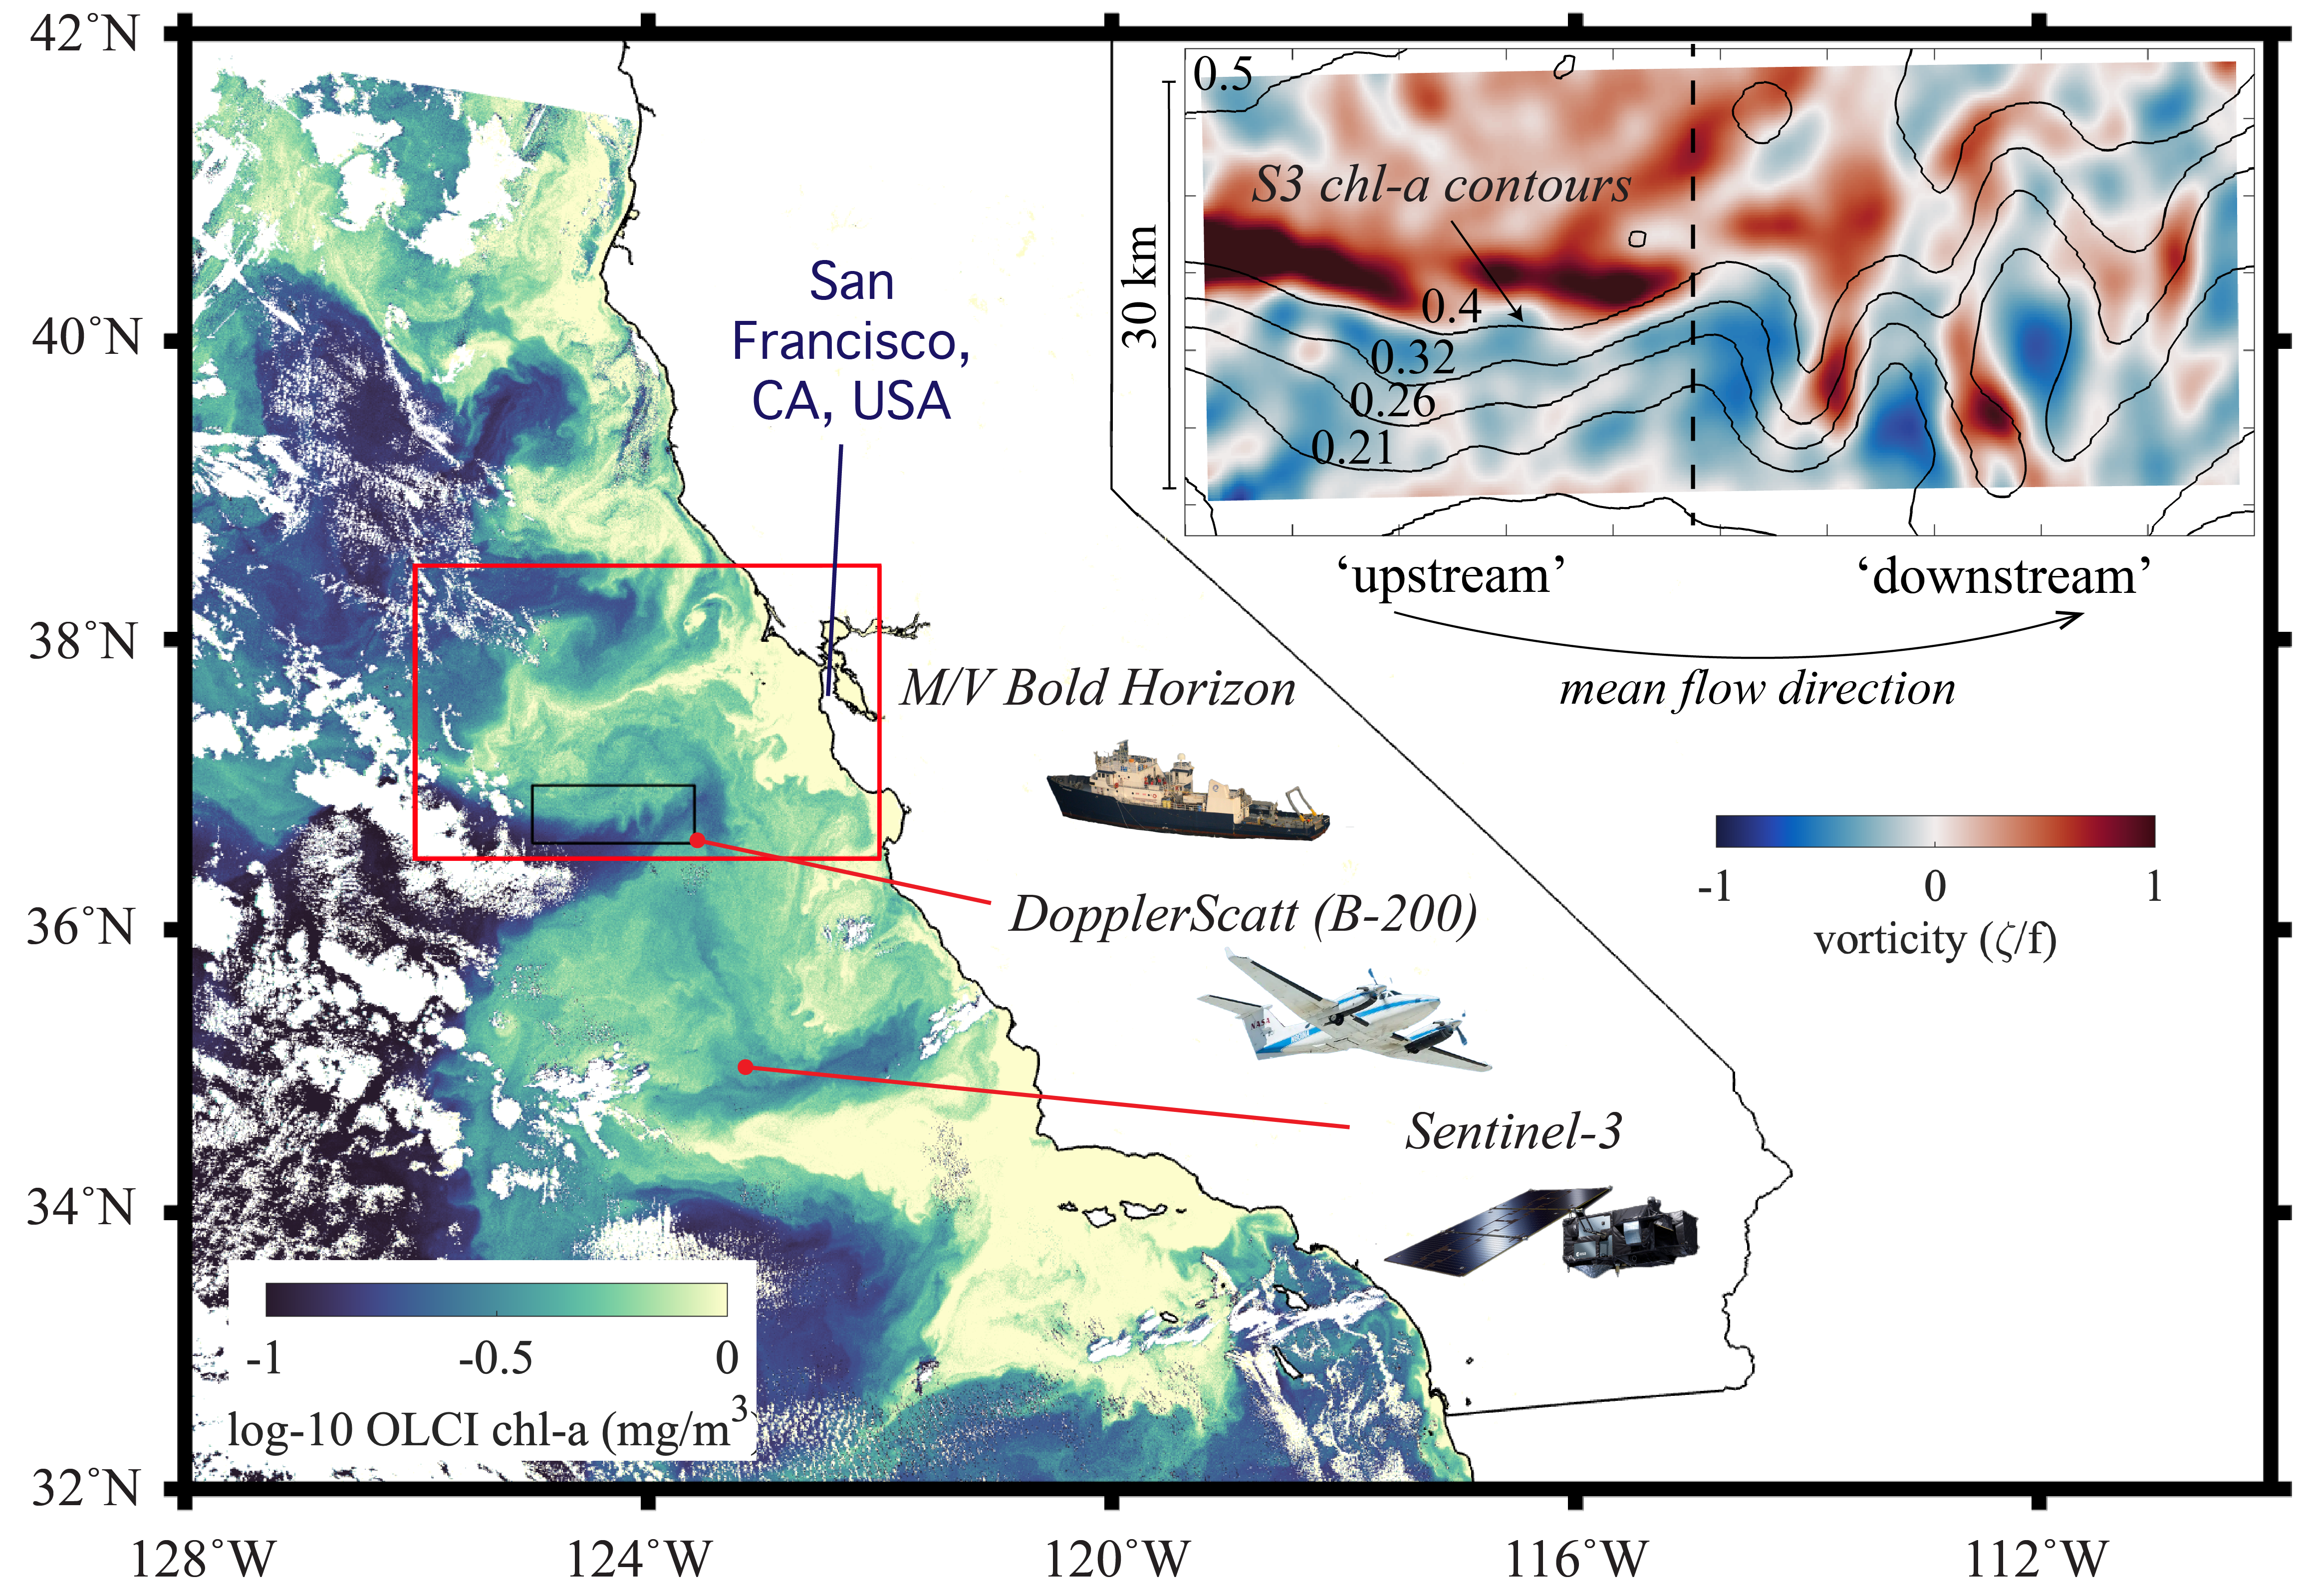
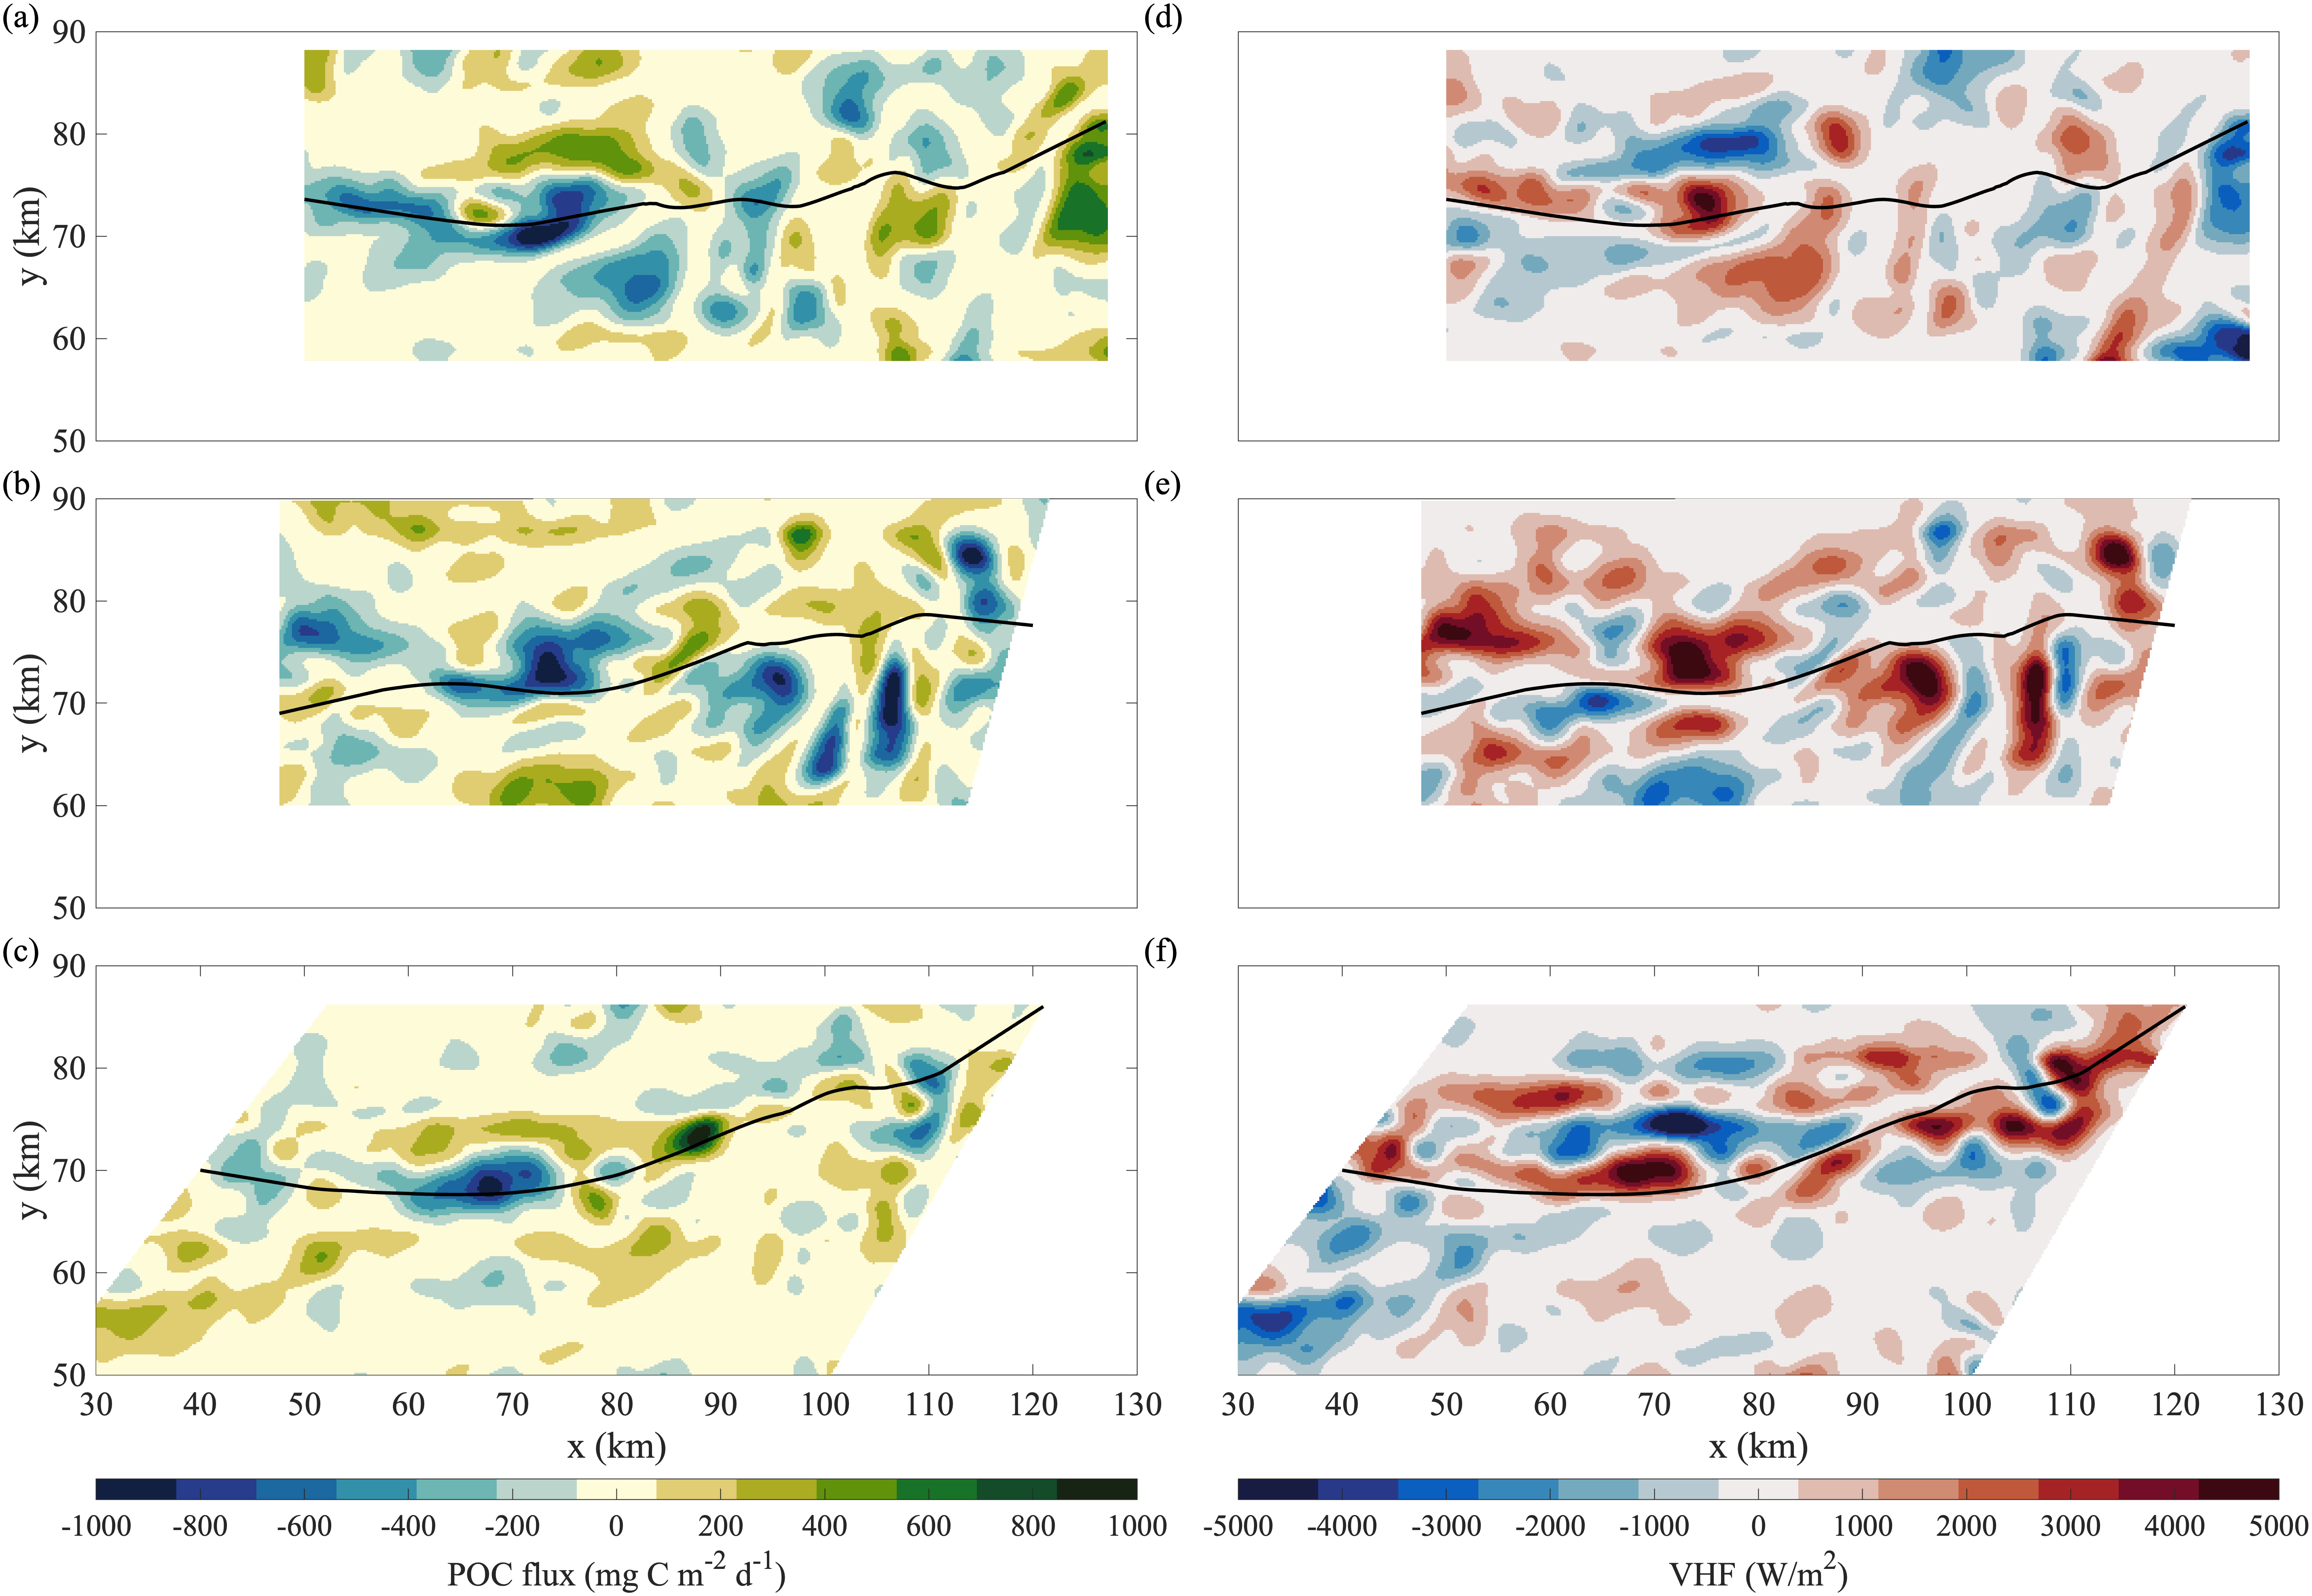
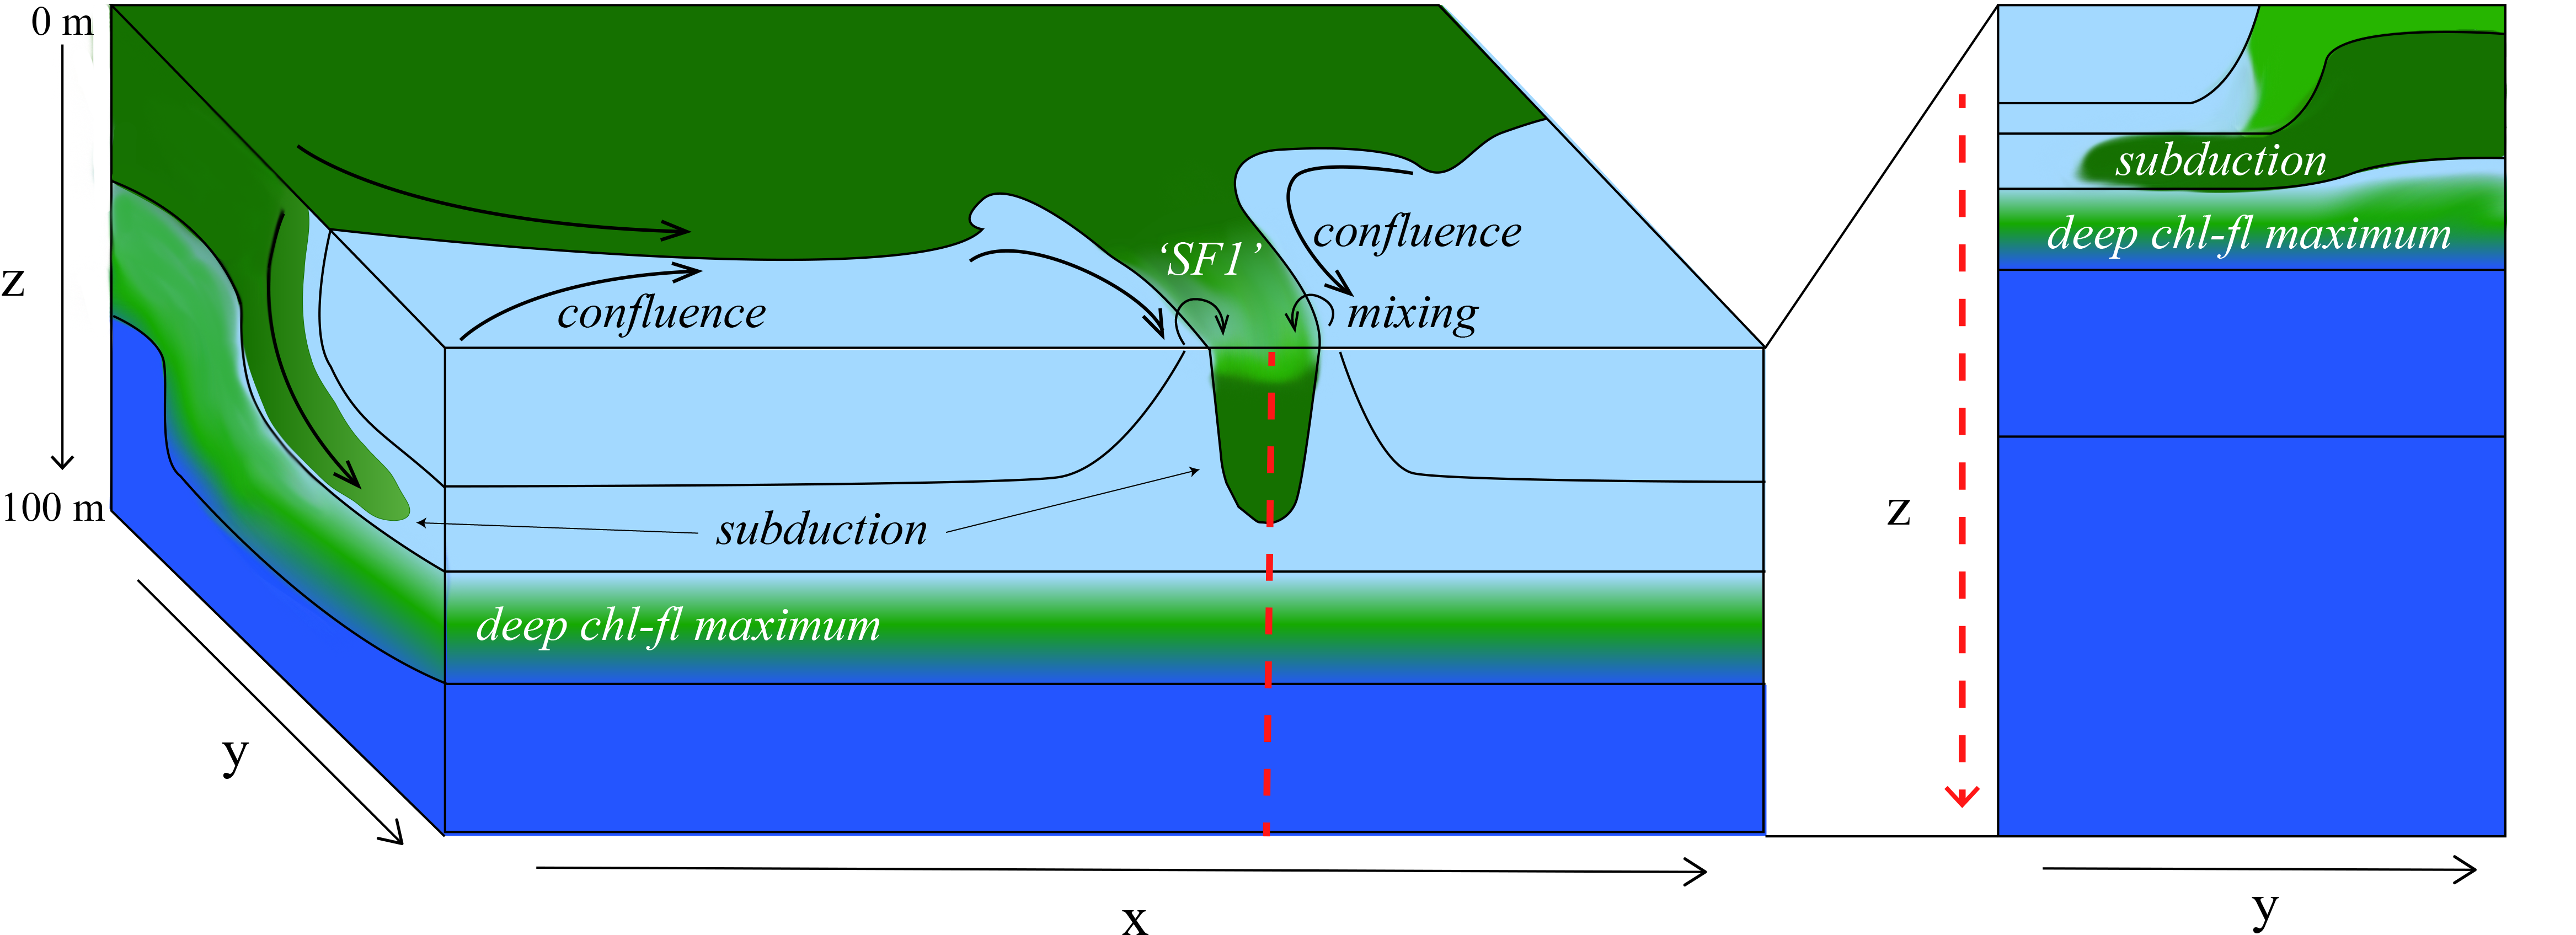
Abstract: Modeling studies have shown that submesoscale (1-10 km) vertical velocities at fronts enhance the exchange of particulate organic carbon (POC) and heat between the surface ocean and depth. While POC and temperature can be readily assessed in situ, direct quantification of transport remain uncertain due to the observational challenges of measuring submesoscale vertical velocities in the upper ocean. NASA’s DopplerScatt is a novel airborne instrument that enables derivation of submesoscale vertical velocities from high resolution surface currents. Here, we provided novel estimates of eddy-driven subduction by pairing DopplerScatt-derived vertical velocities with POC estimates from satellite ocean color (Sentinel-3 OLCI) in a persistent upwelling frontal structure in the central California Current System. We documented the evolution of the frontal structure as it developed strong vertical velocities (O(100 m/day)) leading to a net POC flux of 30.6 ± 7.0 mg C m-2 day-1 downwards and a coincident upward vertical heat flux of 163.5 ± 36.0 W m-2 (estimated using Sentinel-3 SLSTR sea surface temperature). Downward POC flux was associated with upward vertical heat flux (R2 = 44%). Spatial distributions of fluxes, surface kinematics, and high resolution bio-optical and hydrographic profiles from the M/V Bold Horizon captured the underlying dynamics leading to vertical transport below the mixed layer. The front was characterized by two dynamical regimes, based on its characteristics in surface kinematics and frontal sharpness: ‘upstream’ and ‘downstream.’ In the earlier ‘upstream’ domain, where the front was sharper, large negative (positive) POC (vertical heat) fluxes occurred along the dense side of the front where positive vorticity and strain were enhanced. Here, vertical fluxes were associated along-isopycnal transport below the mixed layer induced by frontal overturning. The later stage of frontal evolution represented by the ‘downstream’ domain had patchier spatial distributions of fluxes enhanced in filaments and instabilities. One such filament developed strong positive vorticity, strain, and vertical velocities on super-inertial time scales and subducted 1300 mg C m-2 day m-1 below the shallow mixed layer. By providing novel estimates of eddy-subduction fluxes and characterizing the associated frontal evolution, this study contributes to the understanding of how submesoscale processes modify carbon export in the highly productive California Current System. This measurement approach can be expanded to other regions to further understand the influence of eddy-driven subduction on the marine carbon cycle.

<!--
  See https://www.debugbear.com/blog/responsive-images#w-descriptors-and-the-sizes-attribute and
  https://developer.mozilla.org/en-US/docs/Learn/HTML/Multimedia_and_embedding/Responsive_images for info on defining 'sizes' for responsive images
-->


    <source
      class="responsive-img-srcset"

        srcset="/assets/img/Figure1_horizontal(1)-480.webp 480w,/assets/img/Figure1_horizontal(1)-800.webp 800w,/assets/img/Figure1_horizontal(1)-1400.webp 1400w,"
        type="image/webp"


        sizes="95vw"

    >


<img
  src="/assets/img/Figure1_horizontal(1).png"

    class="img-fluid rounded z-depth-1"


    width="100%"


    height="auto"


    title="Overview of mesoscale flow field and evolution of front"


    loading="eager"

  onerror="this.onerror=null; $('.responsive-img-srcset').remove();"
>
</picture>
</figure> –> <!–
.png)
–>

<!--
  See https://www.debugbear.com/blog/responsive-images#w-descriptors-and-the-sizes-attribute and
  https://developer.mozilla.org/en-US/docs/Learn/HTML/Multimedia_and_embedding/Responsive_images for info on defining 'sizes' for responsive images
-->


    <source
      class="responsive-img-srcset"

        srcset="/assets/img/lineplot(2)-480.webp 480w,/assets/img/lineplot(2)-800.webp 800w,/assets/img/lineplot(2)-1400.webp 1400w,"
        type="image/webp"


        sizes="95vw"

    >


<img
  src="/assets/img/lineplot(2).png"

    class="img-fluid rounded z-depth-1"


    width="100%"


    height="auto"


    title="lineplots"


    loading="eager"

  onerror="this.onerror=null; $('.responsive-img-srcset').remove();"
>
</picture>
</figure> –> <!–
.png)
–> <!–
.png)
–> <!–
.png)
–> <!–
.png)
–> <!–
.png)
–>
